Travel Time Contour Maps
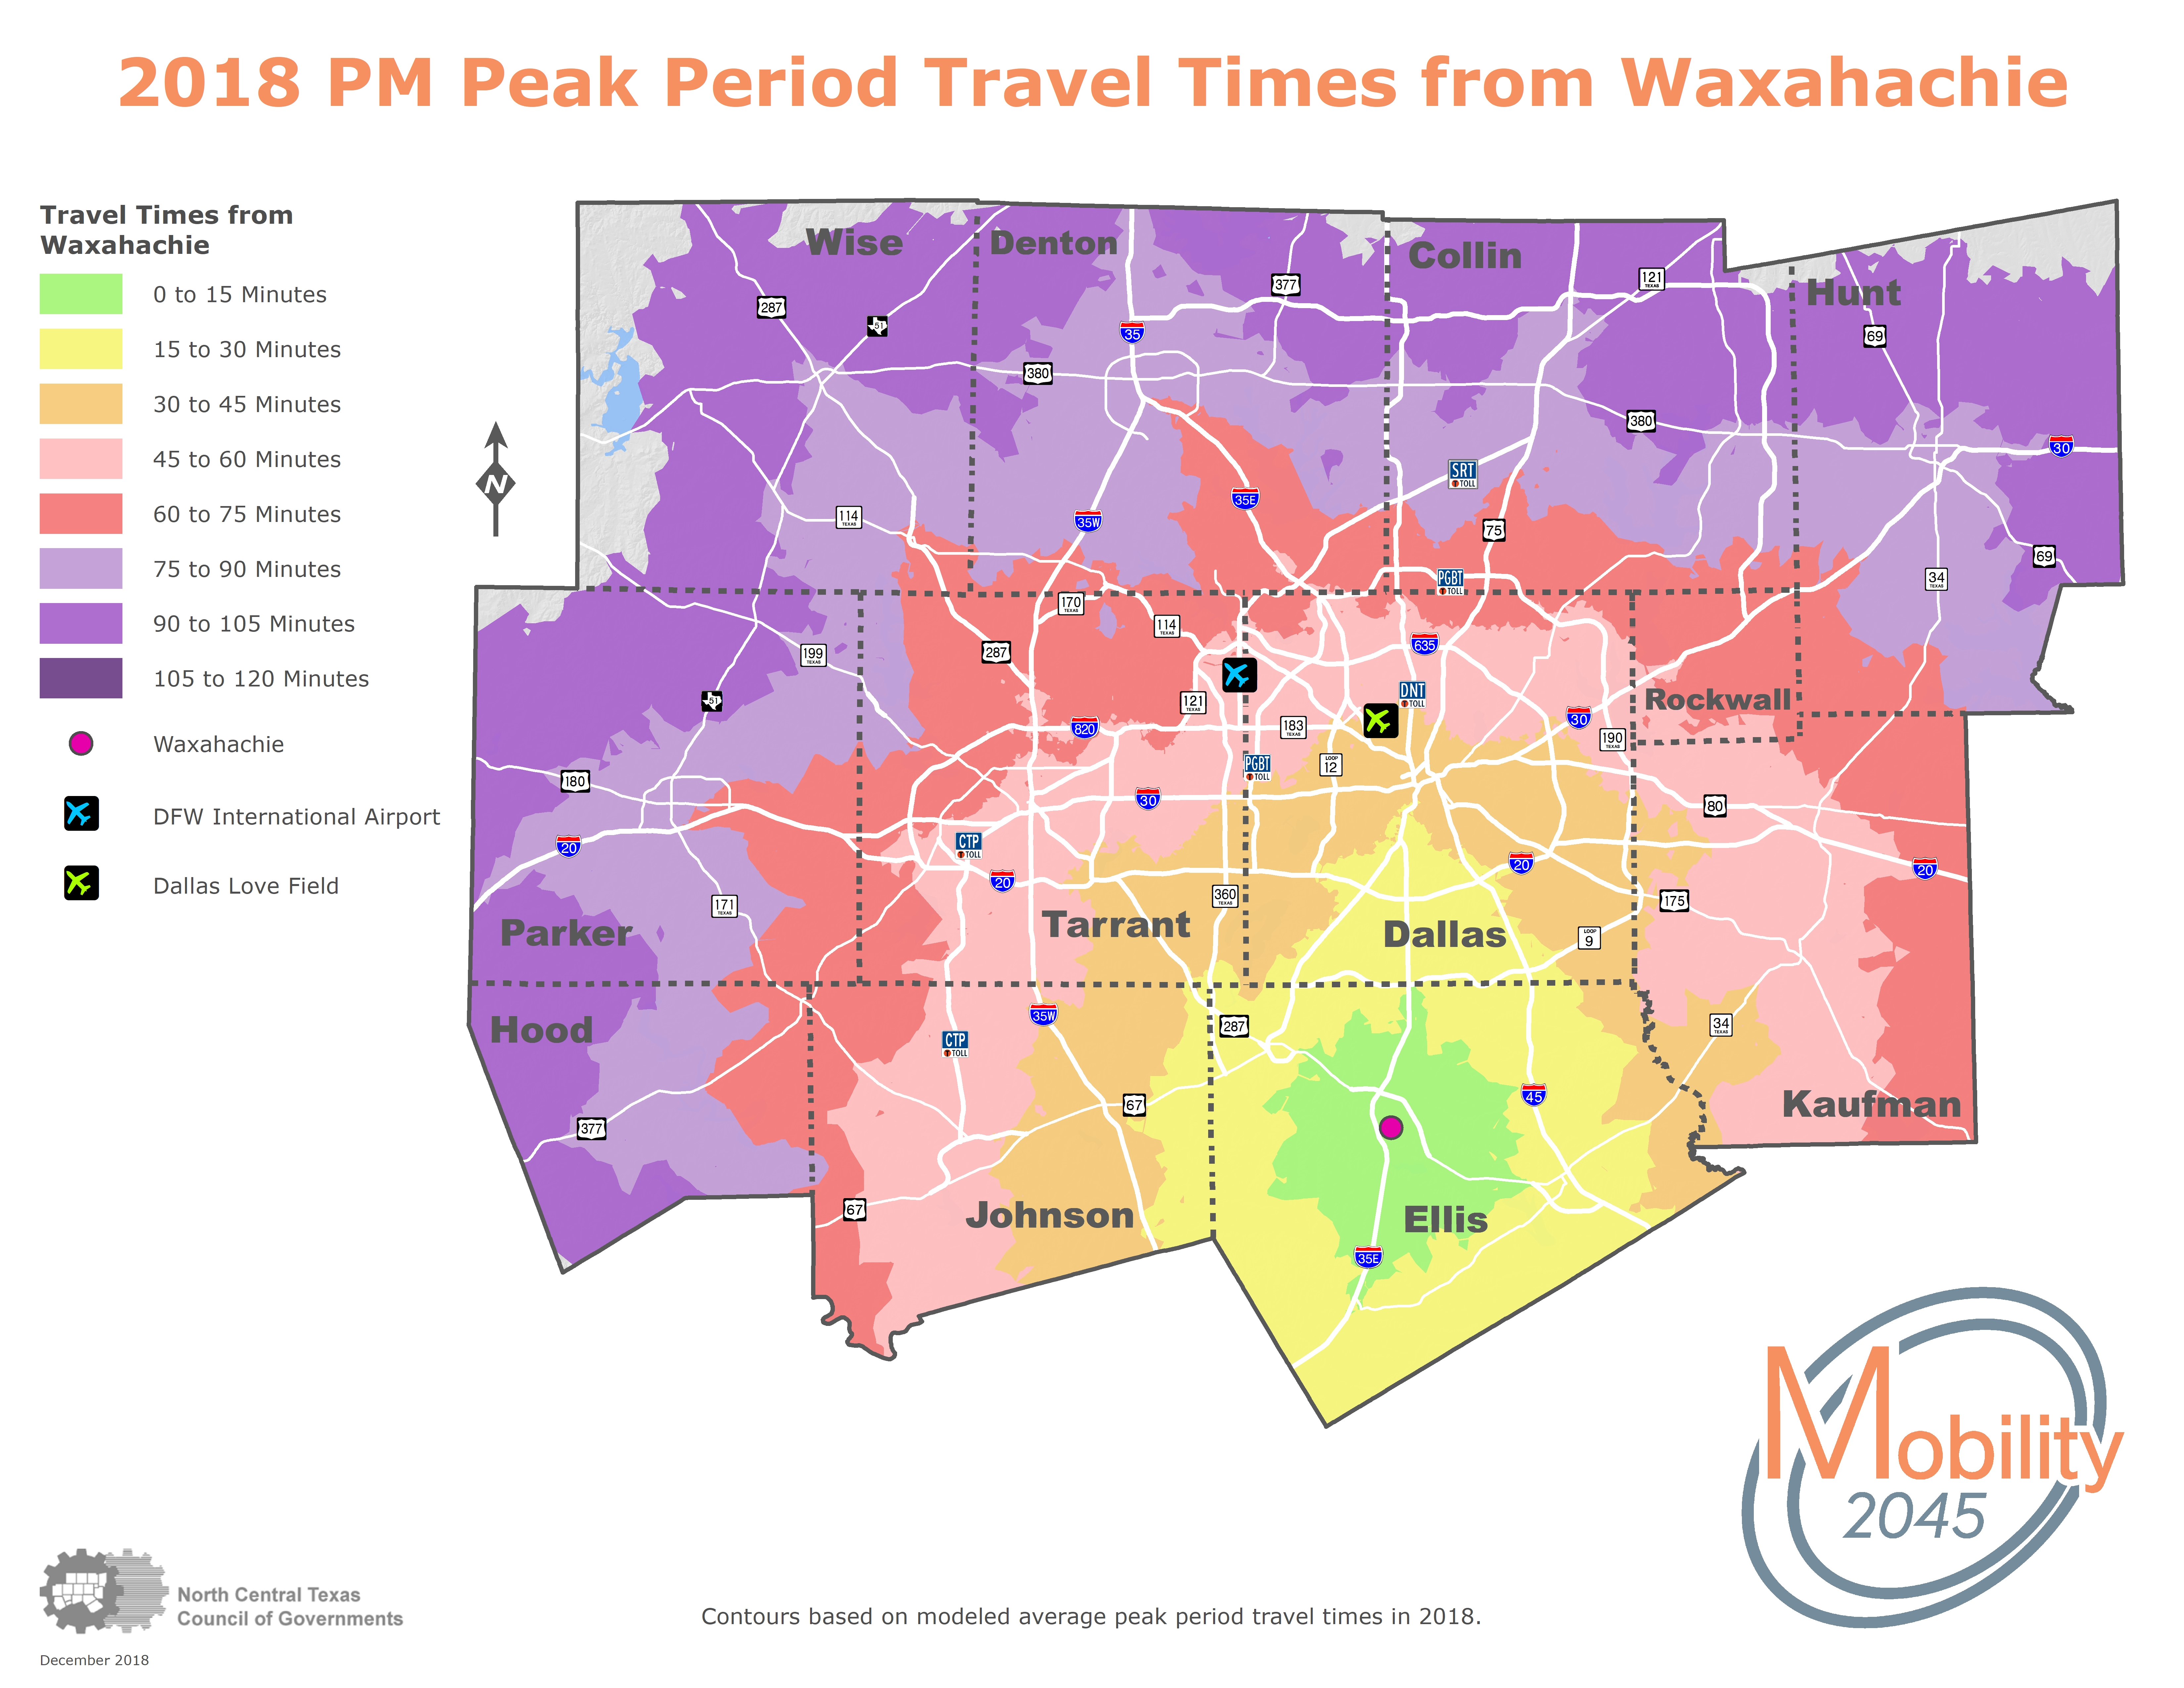
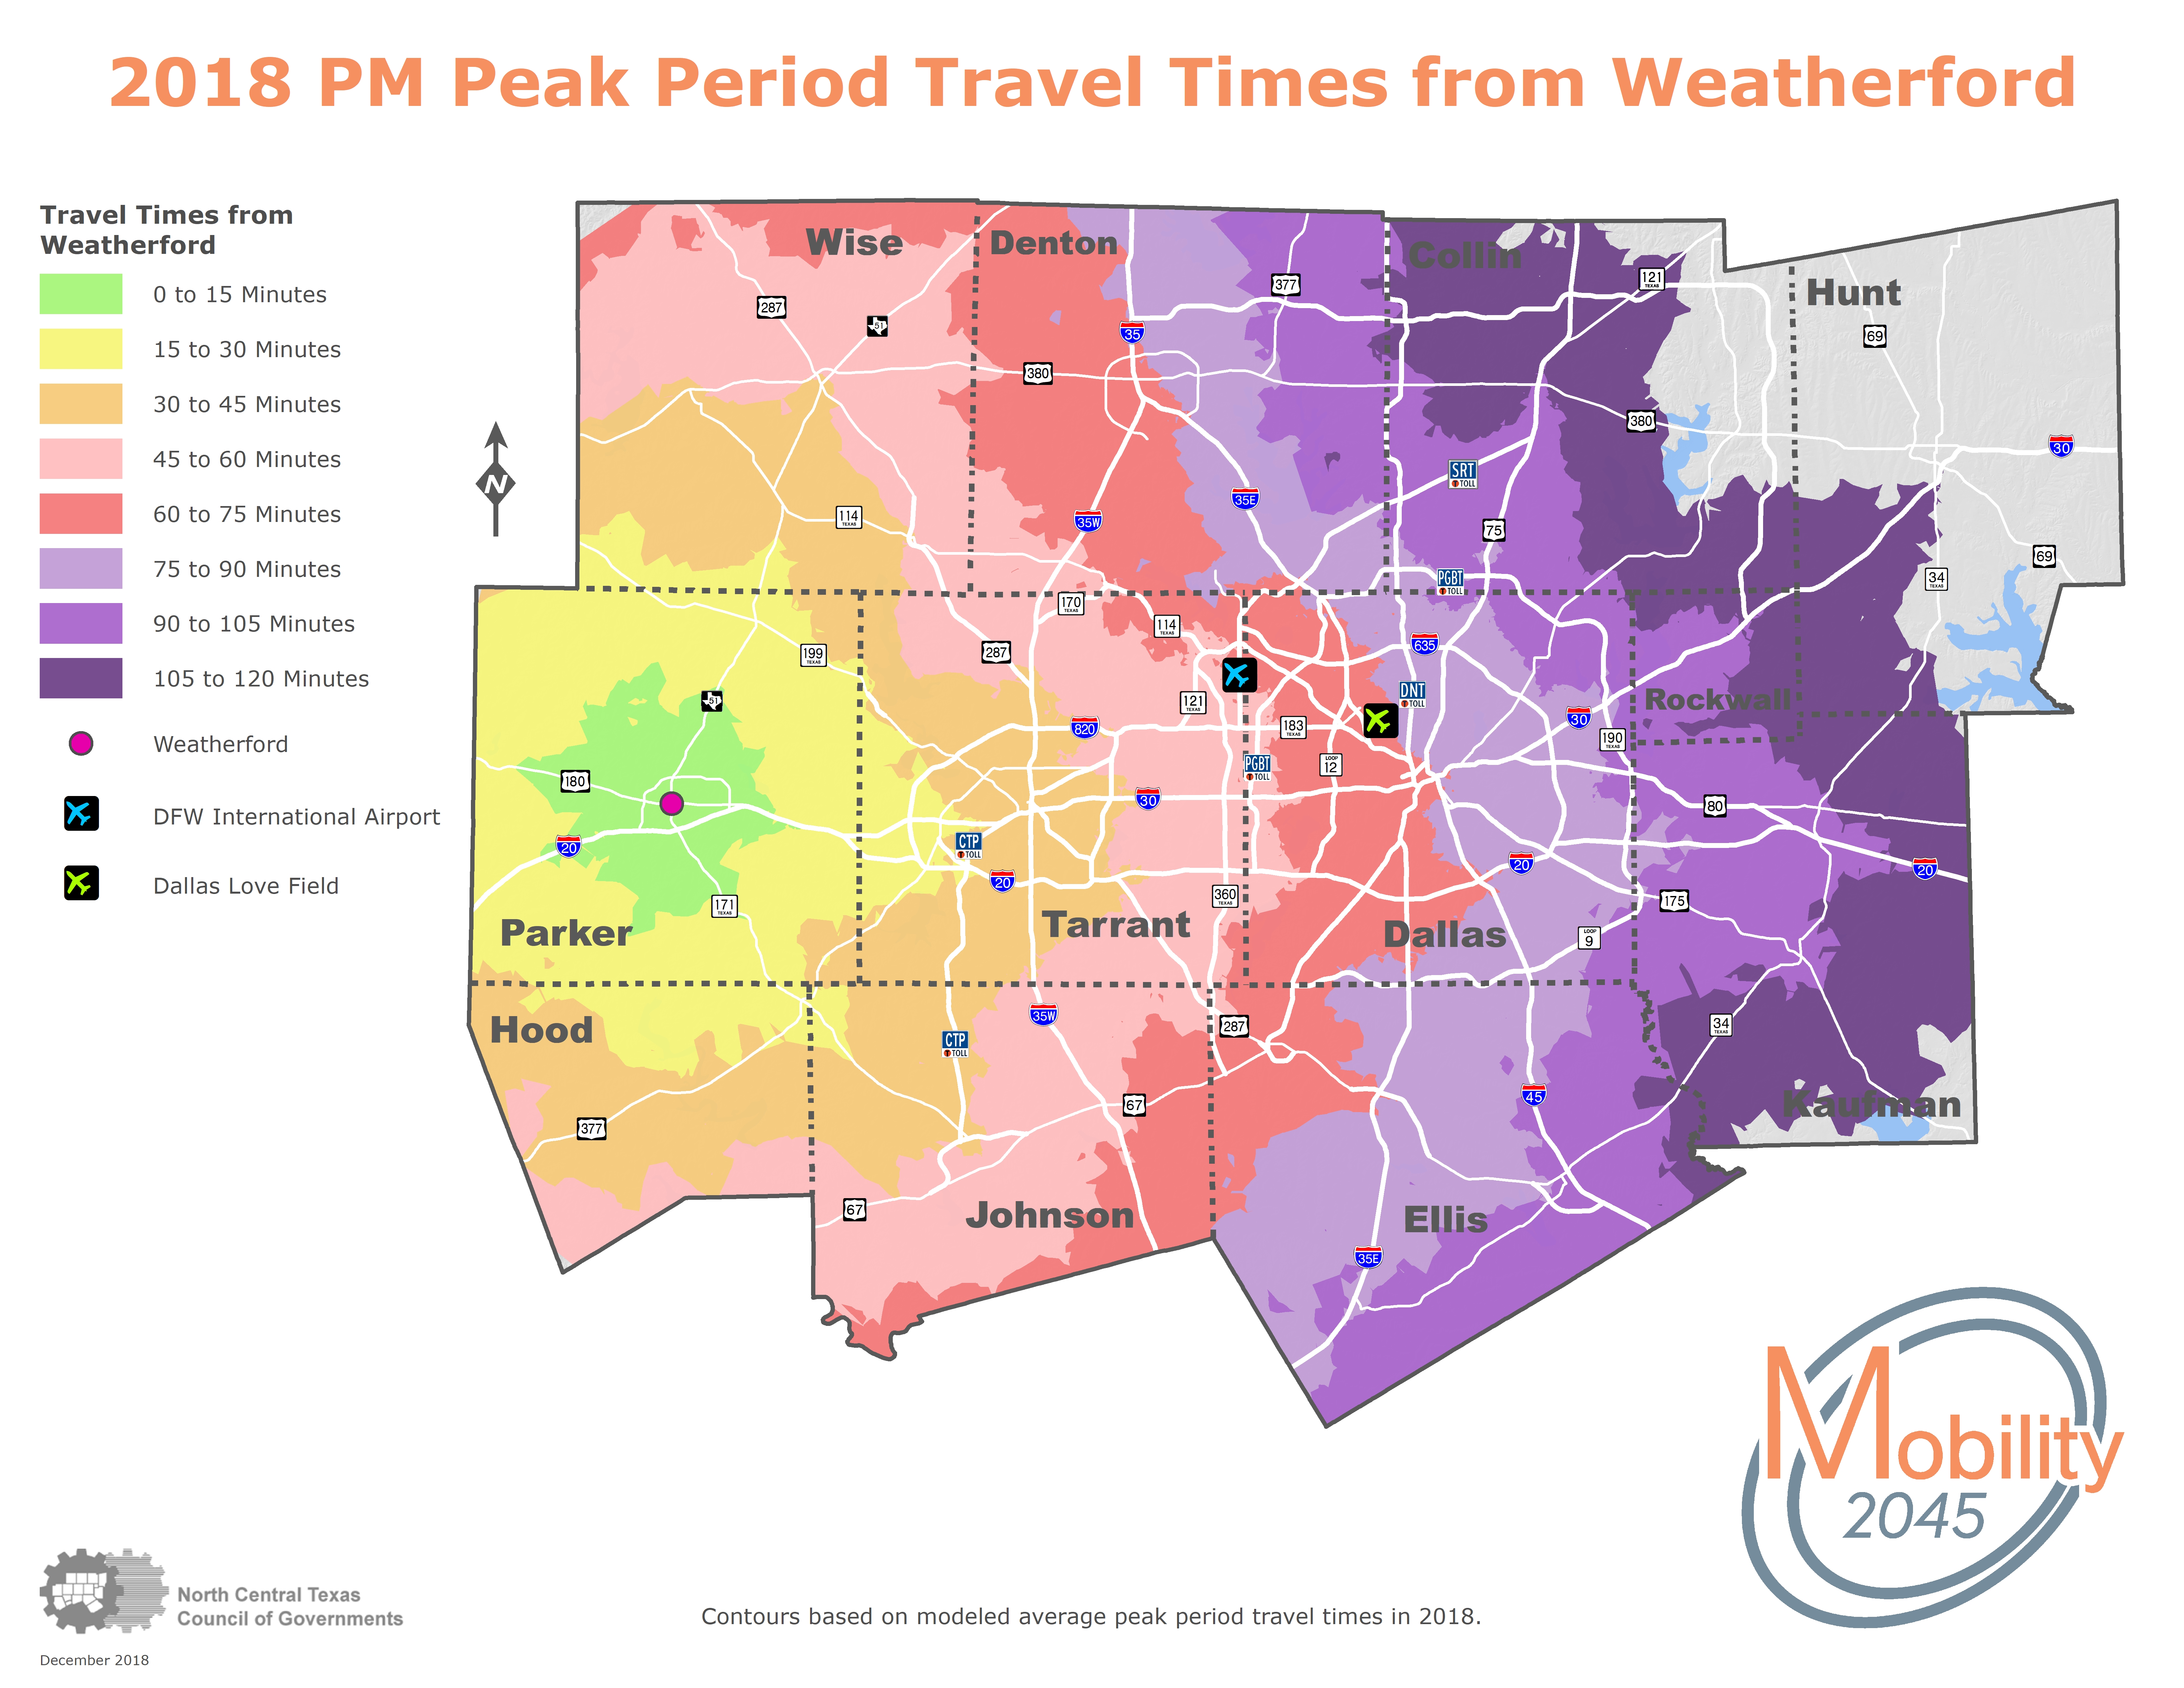
The Travel Time Contours provide a graphic interpretation of how long it would take a vehicle to travel across the region in peak congestion. The contours were produced in 15-minute intervals from each County Seat in the Metropolitan Planning Area for the years 2018 and 2045. The speed data is based on Mobility 2045 roadway networks using NCTCOG's regional travel demand forecasting model.
Collin County
2018 |
2045 |
|
|
|


Dallas County
2018 |
2045 |
|
|
|


Denton County
2018 |
2045 |
|
|
|


DFW Airport
2018 |
2045 |
|
|
|
.38b55a.jpg?width=435&height=336 "DFW_2018-(1).jpg")

Ellis County
2018 |
2045 |
|
|
|

Hood County
2018 |
2045 |
|
|
|


Hunt County
2018 |
2045 |
|
|
|
.bac909.jpg?width=435&height=336 "Greenville_2018-(2).jpg")
.b597df.jpg?width=435&height=336 "Greenville_2045-(2).jpg")
Johnson County
2018 |
2045 |
|
|
|


Kaufman County
2018 |
2045 |
|
|
|
.b1f874.jpg?width=435&height=336 "Kaufman_2018-(1).jpg")

Parker County
2018 |
2045 |
|
|
|

Rockwall County
2018 |
2045 |
|
|
|

Tarrant County
2018 |
2045 |
|
|
|
.dc43f6.jpg?width=435&height=336 "FortWorth_2018-(2).jpg")
.a5e93d.jpg?width=435&height=336 "FortWorth_2045-(1).jpg")
Wise County
2018 |
2045 |
|
|
|

