Transit Trends
 Public transportation continues to evolve in North Central Texas and across the nation. No longer limited to the familiar buses and trains that have been used for decades, public transportation agencies are embracing new technologies and new service models to better serve communities.
The region's buses, trains, light-rail vehicles, vans, and streetcars provide mobility for people without cars and an alternative to driving for all users of the transportation network. Public transit reduces the number of cars on the roads, relieves congestion on the roadway system, improves regional air quality, and supports regional economic competitiveness.
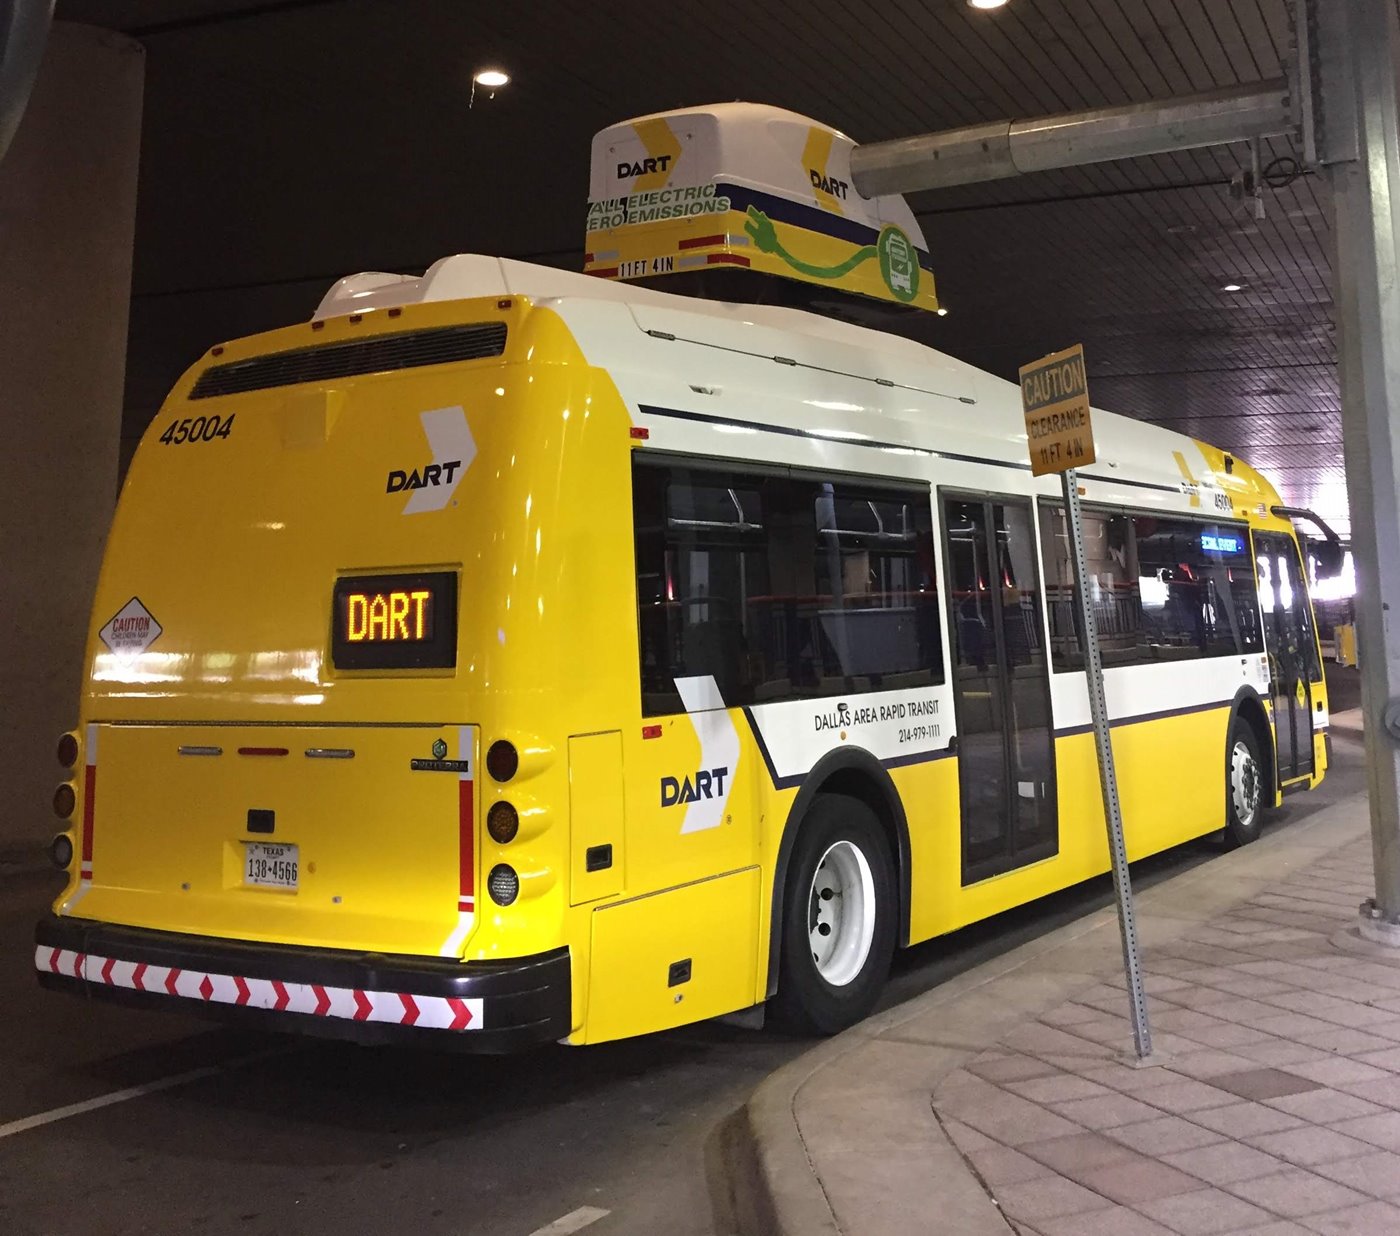
New transit technologies and modes being introduced and planned in the region include high-speed rail, Hyperloop, autonomous vehicles, and the electrification of transit fleets. The implementation of these technologies is being explored and planned by NCTCOG and its partner transit providers in the region. These technologies are being planned to integrate into a more comprehensive, safer, and cleaner regional transportation system that can better serve the needs of all residents, workers, and visitors in North Central Texas.
North Central Texas is a host to several new service models to increase mobility beyond traditional transit. This includes the concepts of Mobility-on-Demand (MOD) and Mobility as a Service (MaaS) through services like Via in Arlington and the implementation of new On-Demand zones through DART and Trinity Metro in areas previously underserved by traditional transit. Learn more about our Mobility on Demand Working Group.
The dashboard below displays ridership trends for 2023 - 2024 across various fixed-route and on-demand rideshare services in the NCTCOG region. Ridership performance, aggregated by quarter, can be viewed by transit mode (rail, bus, rideshare) as well as by transit provider.
To view full data, enlarge charts by clicking on the expand icon on the top-right corner of each chart. To filter data points, click on the Legend elements to toggle categories on/off. Open on a desktop for best viewing experience.
NOTE: The Hover Labels show ridership in decimal format rounded to the nearest tenth, not actual values.
Data Sources: DART, Trinity Metro, DCTA, and MATA.
Update Cycle: Quarterly
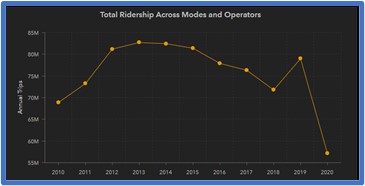
The Regional Ridership Trends Dashboard displays total annual unlinked passenger trips over the last decade to give a snapshot of long-term changes in public transit ridership in the region. In addition to displaying aggregated ridership trends for the region, some charts display trends by transit provider or transit mode.
For most modes, transit ridership has either slowly declined or remained relatively constant in the region prior to the significant disruption to public transit demand and the broader transportation network caused by the COVID-19 pandemic. Since 2021, ridership has begun a consistent recovery across the various transit modes.
To view full data, enlarge charts by clicking on the expand icon on the top-right corner of each chart. To filter data points, click on the Legend elements to toggle categories on/off. Open on a desktop for best viewing experience.
NOTE: The Hover Labels show ridership in decimal format rounded to the nearest tenth, not actual values.
Data Source: National Transit Database
Update Cycle: Annually
For more information about emerging transit trends, contact us at TOTeam@nctcog.org or contact a member of the Transit Team.

