Routes to Rail

Bike rider on trainThe 2014 Active Transportation Routes to Rail study is an update to the 2003 Access to Rail study performed by NCTCOG. Using 2013 data related to existing and planned sidewalks, trails, and bikeways, the Active Transportation Routes to Rail study examines walking and biking routes within a one-half mile radius of the existing 74 light rail and commuter rail stations in the Dallas – Fort Worth (DFW) region (this study does not currently include the DFW International Airport Station). The regional rail network includes Dallas Area Rapid Transit (DART), Trinity Railway Express (TRE), and Denton County Transportation Authority (DCTA) with stations located in 14 cities across four counties.

The Active Transportation Routes to Rail maps identify:

  • One-half mile radius around each rail station
  • Existing pedestrian facilities
  • Continuous routes for pedestrians and one-half mile actual walking distances from each station
  • Existing bicycle facilities
  • Planned bicycle facilities


To view the Active Transportation Routes to Rail maps please click here.

The purpose of the Active Transportation Routes to Rail study is to provide a resource for cities, transit agencies, property owners, and individuals to understand the active transportation options (biking and walking) to reach each rail station in the DFW region. The Routes to Rail study completed in 2014 differs from the 2003 Access to Rail study in that the pedestrian portion of the study is focused on the active walk distance (walkshed) using existing pedestrian facilities, which is impacted by gaps in the pedestrian network and other barriers of walking to and from a rail station. This study does not specifically identify gaps in the network. However, the study overlays routes on aerial photographs enabling the reader to view existing developed areas around each station which lack pedestrian or bicycle facilities. As a result, stakeholders and decision makers have a better understanding of areas needing further study for possible infrastructure investment to improve network connectivity and increase the geographic area included within the actual half-mile walking distance of each station.  Click on each blue panel below to read more about routes to rail. 

FTA Planning Grant Study of First- and Last-Mile Pedestrian Connections to Red and Blue Line DART Stations

As a component to a $1.4 million Federal Transit Administration planning grant, awarded to NCTCOG in 2016 to help the region enhance multimodal accessibility and development, a study was completed in 2020, which analyzed pedestrian connectivity around 28 DART stations along the system’s Blue and Red lines in Dallas, Garland, Richardson, and Plano. An assessment of streets, sidewalks, and other routes connecting the commuter rail stations examined infrastructure that will enhance first and last-mile accessibility for pedestrians. The study included detailed evaluations of pedestrian infrastructure needs for corridors within a one-half mile radius of the DART facilities, wherein improvements were identified and ranked as High, Medium, and Low, based on the potential benefit to improve active user access to and from the stations.
 
Estimated construction costs, primarily for new sidewalks and pedestrian safety measures such as crosswalks, signals, and phasing for implementation, were developed for each station area. The resulting project deliverables and final reports were provided to DART and each city to be referenced during future project development, helping to improve access and connectivity for residents and workers with the key goal to increase transit ridership.
 
A map of the study area, an Opinion of Probable Construction Cost (OPCC) table for all recommended infrastructure improvements, as well as all of the final reports for DART, Dallas, Garland, Plano, and Richardson, can be read on NCTCOG’s FTA Pilot web page, by clicking on the “First/Last Mile Routes to Rail Stations” heading.

Denton County Transportation Authority (DCTA) A-Trail Routes to Rail

In 2023 a Study was completed to analyze pedestrian first/last mile connectivity around six DCTA A-Train commuter rail stations in Denton, Lewisville, and Carrollton.
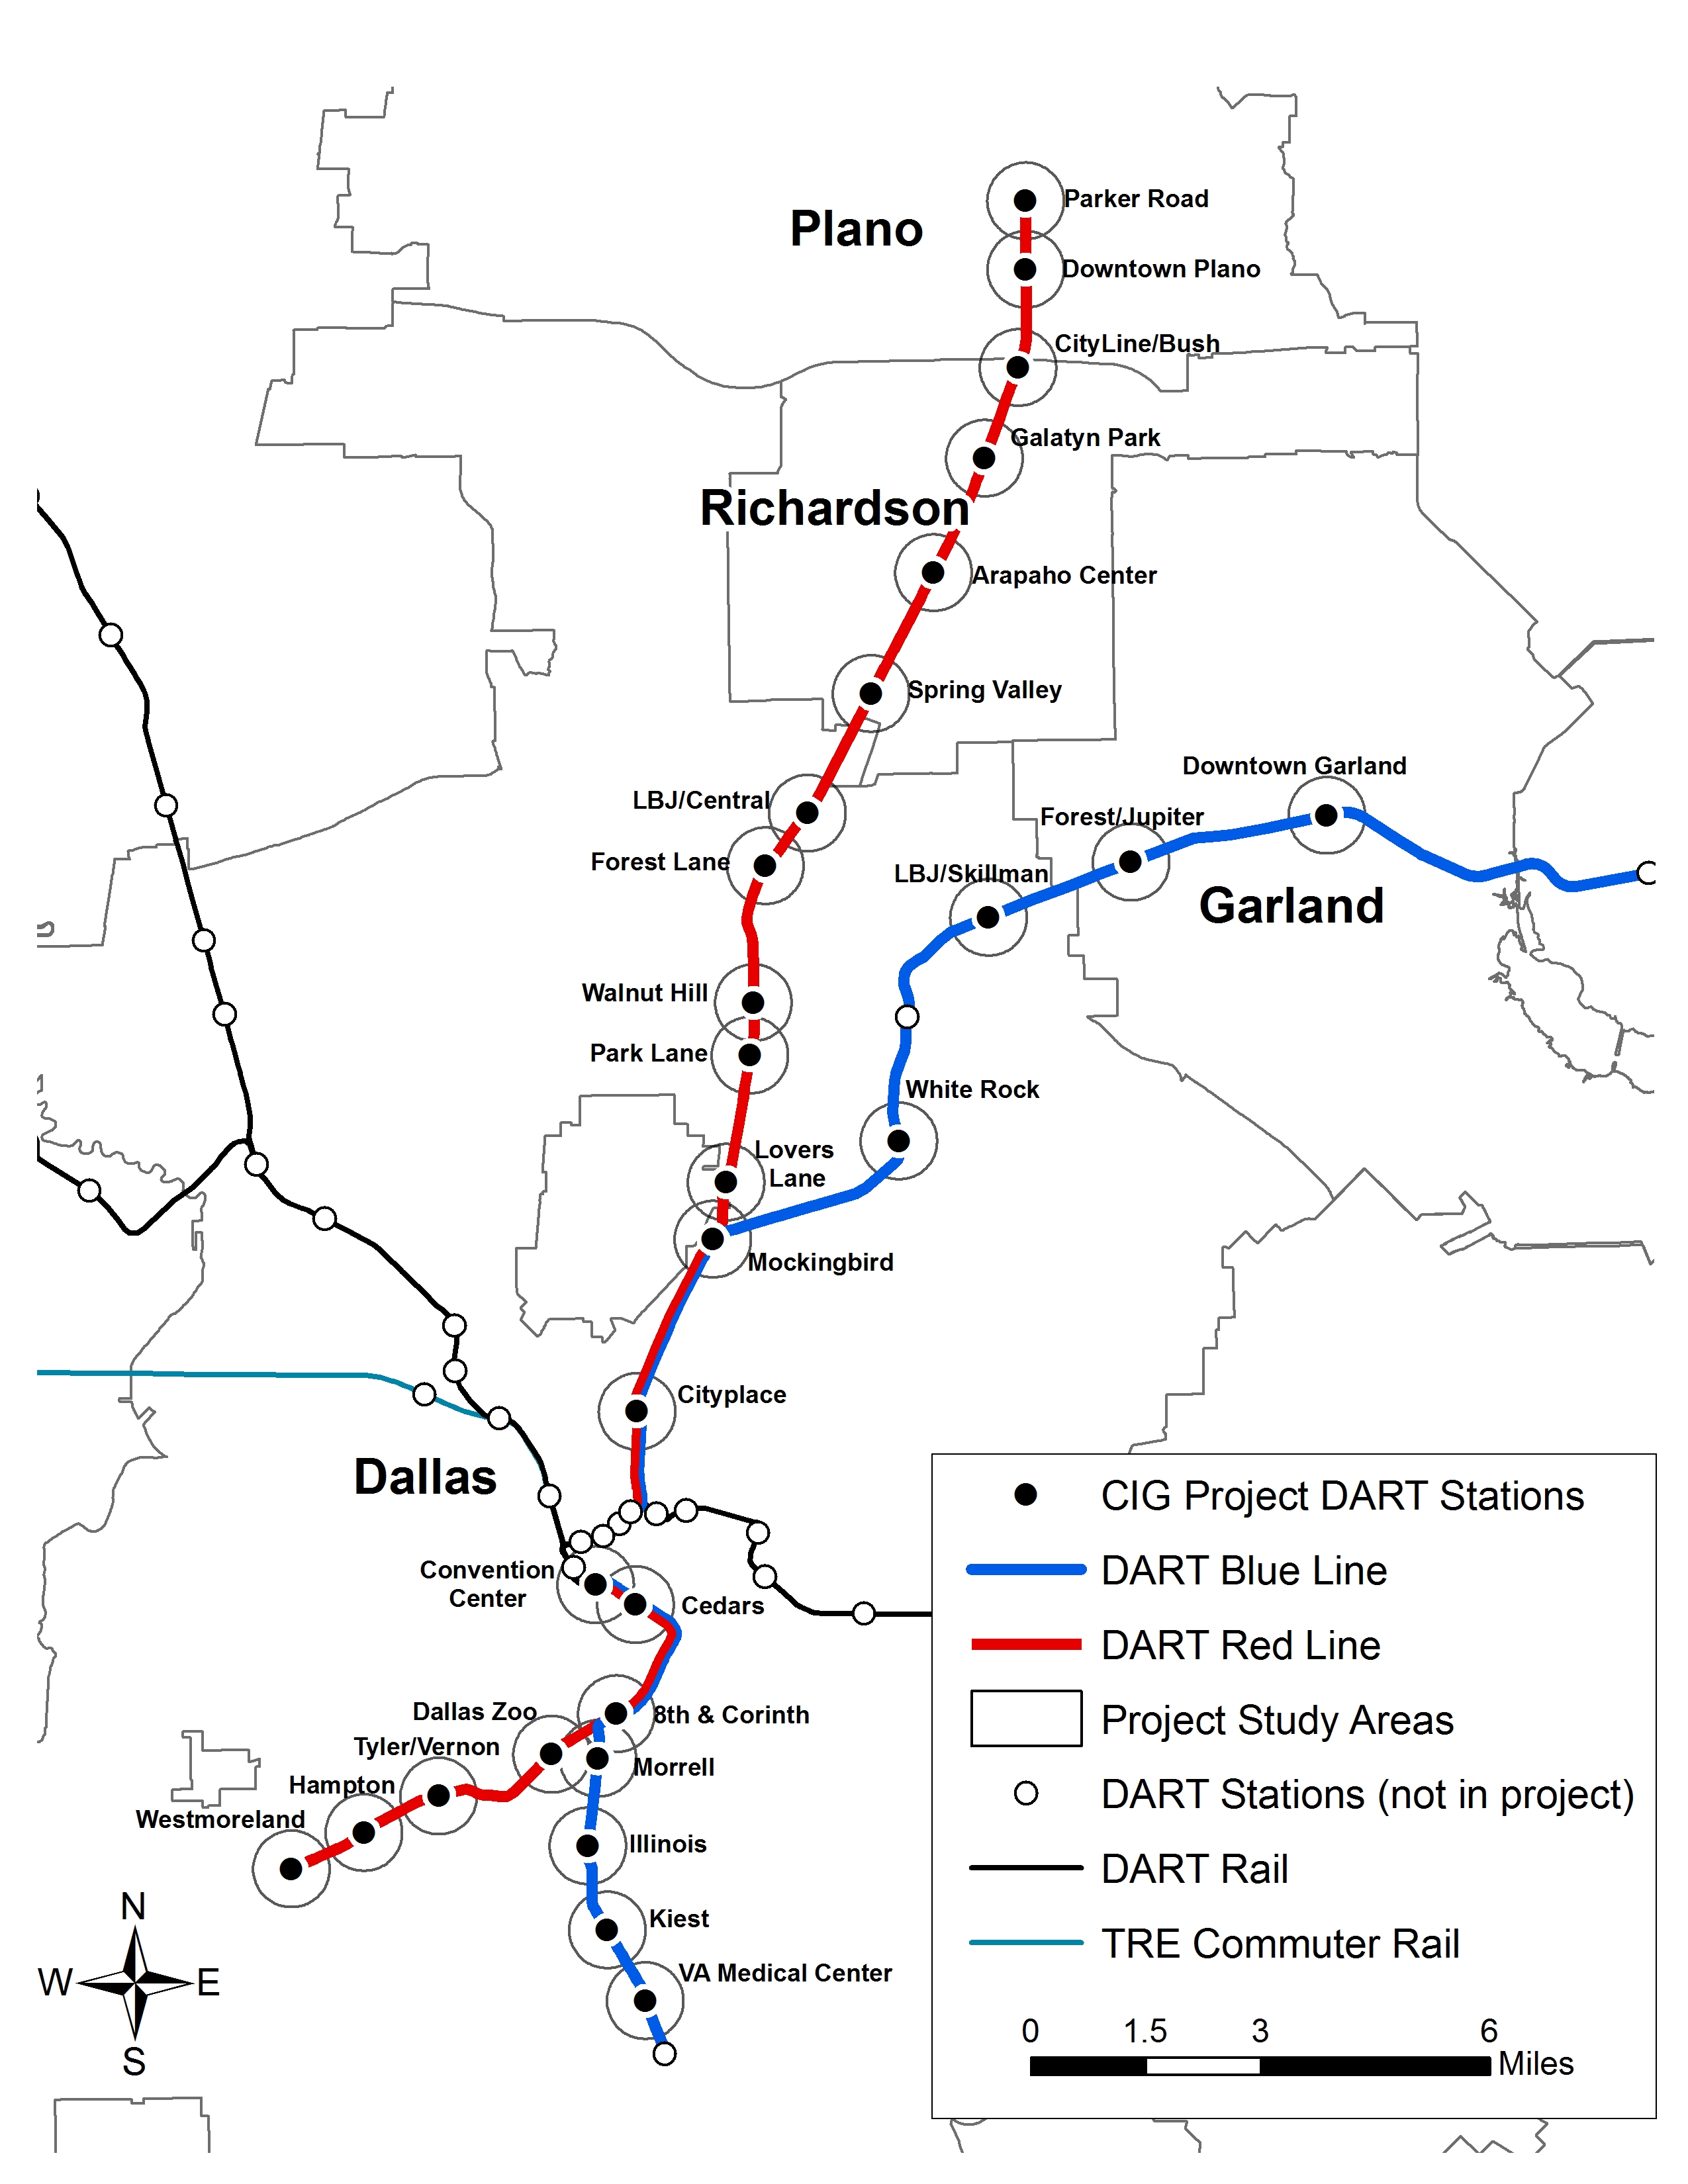
 Within a one-half mile around each rail station, the pedestrian network was analyzed to review current street conditions and to find opportunities for new pedestrian routes to occur with the rail system. The proposed pedestrian improvements and Opinions of Probable Construction Costs can be viewed on the DCTA A-Train Routes to Rail Stations web page.

Pedestrian Routes to Rail


Pedestrian Routes to Rail is a GIS network-based assessment that focuses on the routes and walking distances from rail stations. ArcGIS Network Analyst tool was used to identify continuous pedestrian routes that are less than or greater than a half-mile actual walking distance from each station. For this analysis existing pedestrian facilities are defined as sidewalks and multi-use paths.

Graphic of .5 mile walk distance

To view the Active Transportation Routes to Rail maps please click here.

The Pedestrian Routes to Rail maps identify the following:

One-Half Mile Walk Distance Beyond One-Half Mile Walk Distance Disconnected Pedestrian Facilities
Identifying pedestrian routes within the .5 mile walk distance from a transit stop. Identifying pedestrian routes beyond the .5 mile walk distance from a transit stop. Diagram showing disconnected pedestrian facilities.
Continuous pedestrian routes on existing sidewalks and trails with a walking distance of less than one-half mile from the rail station (yellow lines). Continuous pedestrian routes on existing sidewalks and trails with a walking distance of greater than one-half mile from the rail station (orange lines).
Existing sidewalks and trails within the half-mile radius of the rail station that are disconnected from the pedestrian network due to gaps or other barriers, hindering a continuous route to a station (red lines). 
Click on the images for an enlarged view.
 
Bicycle Routes to Rail


The Bicycle Routes to Rail portion of this study identifies all existing and planned bikeways in proximity to existing light rail and commuter rail stations in the DFW region based on 2013 data. The maps reflect off-street paths (trails) and streets designated by local adopted master plans for dedicated bikeways (e.g. bike lanes, cycle tracks) located on the street. In accordance with the Texas Transportation Code, bicyclists have a right to the road. As such, the map does not reflect other roadways around the station that may have signed bike routes or by state law may be used by bicyclists.

To view the Active Transportation Routes to Rail maps please click here.

The Bicycle Routes to Rail portion of this study identifies all existing and planned bikeways in proximity to existing light rail and commuter rail stations in the DFW region based on 2013 data. The maps reflect off-street paths (trails) and streets designated by local adopted master plans for dedicated bikeways (e.g. bike lanes, separated bike lanes) located on the street. In accordance with the Texas Transportation Code, bicyclists have a right to the road. As such, the map does not reflect other roadways around the station that may have signed bike routes or by state law may be used by bicyclists.

In January 2022, analysis was completed to calculate the approximately 417 miles of planned trails and on-street bikeways reflected in Mobility 2045 within a one-mile radius of all 93 rail stations (DART, DCTA, Trinity Metro/TEXRail, and TRE) in the region.  High level opinions of probable construction costs to implement these planned trails and on-street bikeways total more than $450 million (2022 dollars) based on the cost per mile assumptions included in the table below.  An interactive map of the existing, funded, and planned trails and on-street bikeways near rail stations as reflected in Mobility 2045 can be viewed here

2022 Opinions of Probable Construction Costs (OPCC) for Planned Trails and Bikeways
Within One Mile of a Rail Station
(DART, DCTA, Trinity Metro/TEXRail, TRE)
  Total Stations 93
  Off-Street Paths On-Street Bikeways
Total Planned Mileage 168 249
Facility Type Path within rail
right-of-way*
Path outside of
rail right-of-way*
Bike lane striping on existing roadway Buffered or separated bike lane Bike lane with roadway widening
Mileage by Facility Type 30 miles 138 miles 150 miles** 74 miles** 25 miles**
Cost/Mile (2022)*** $4,000,000 $2,000,000 $100,000 $250,000 $1,000,000
Estimated Cost (2022) $120,000,000 $276,000,000 $15,000,000 $18,500,000 $25,000,000
 
  Total OPCC off-street paths (2022) Total OPCC on-street bikeways (2022)
  $396,000,000 $58,500,000
  Total OPCC off-street paths and on-street bikeways (2022)
  $454,500,000
* Assumes 12-ft. wide trail; includes design, ROW acquisition, and contingency.
** The type of facility design for planned on-street bikeways will be implemented through future engineering design and construction projects.  Thus, the 249 miles of planned on-street bikeway mileage within a one-mile radius of a rail station as represented in Mobility 2045 was allocated as follows: 60% - Bike lane striping on existing roadway; 30% - Buffered or separated bike lane; and 10% - Bike lane with roadway widening.
*** Assumptions of cost per mile are based on information from FHWA, TxDOT, and other local governments. These cost estimates are 2022 dollars. 
Active Transportation Routes to Rail Data Sources and Analyses


The data collected and used as part of this study include:

  1. GIS files of existing sidewalks and pedestrian crossings (2013 data)
  2. Digital aerial photography (orthos), Google Earth, and Google Street View
  3. Adopted trails and bikeway master plans for each city in which a rail station is located
 
Freeway access ramps without marked pedestrian crossings: Major arterial roadways without a marked crossing: Major arterial roadways without a marked crossing:
Identifying Freeway Access Ramps without marked pedestrian crossings Identifying major arterial roadways without a marked crossing. Identifying major arterial roadways without a marked crossing
In the example above, the lack of a designated pedestrian crossing at the ramp is reflected as a disconnect in the pedestrian network. Thus, the existing sidewalk to the left of the intersection (red line) is identified as disconnected from the network. Such locations are examples of areas where improvements may be targeted to improve the safety and connectivity of the pedestrian network.
In the example above, pedestrian facilities on the right side of the street do not extend to the curb or provide ramps to a crossing and is considered disconnected from the pedestrian network. In the example above, existing sidewalks on the right side (yellow lines) of a major arterial are disconnected from existing sidewalks on the left side of the street (red lines). In addition, there are no existing sidewalks on the left side of the major arterial road.
Click on the images for an enlarged view.
Next Steps
 

Resources are being identified and coordination with communities is ongoing to identify additional analysis. Efforts may include:

  • Analysis on ADA accessibility and conditions
  • Overview or review of network in relation to pedestrian and bicyclist safety data
  • Prioritization of jobs, housing, and land uses needing connections
  • Identification of missing infrastructure needed in more developed area


Disclaimer

The information published in the Routes to Rail study shows a reasonable degree of accuracy to provide a snapshot of bicycle and pedestrian networks near existing rail stations in the DFW region. Due to the large number of transportation and development projects in the DFW region, bicycle and pedestrian routes to these rail stations may have changed since the publication of this study. The information in this study does not reflect the physical condition or compliance with the Americans with Disabilities Act (www.ADA.gov) of the existing bicycle and pedestrian infrastructure.

The ArcGIS Network Analyst tool tracks routes from rail stations along the continuous pedestrian network which includes sidewalks, multi-use trails, crosswalks, and unmarked crossings at intersections of minor arterial streets. Physical barriers that create disconnects within the network include highways, access ramps, parking lots, unmarked crossings of major arterials, and sidewalks lacking connections to a pedestrian crossing. Common conditions that create gaps in the pedestrian network are identified above.  

Staff contact: Kevin Kokes